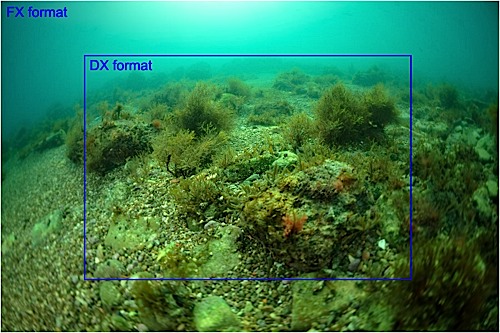
DX or FX
Macro photography – results and discussion.
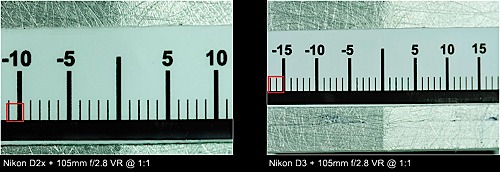
As I have stated before, setting the 105mm macro lens to the shortest focusing distance produced an approximately 24 mm wide crop of the block with Nikon D2x and an approximately 36 mm wide crop with Nikon D3, corresponding to the actual width of their sensors.
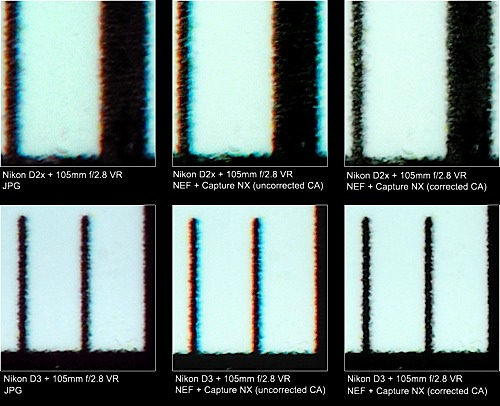
I converted the images from raw NEF format to TIF format using the Capture NX program in two ways: deliberately leaving and deliberately removing the CA. I then compared the results to the direct JPG images from the camera. The sample photos (100% crops) are taken from the edge of the photo, where the effect of CA is the strongest. We can see the JPG image from D2x exhibits very strong CA, perfectly equal to the untouched NEF image. Fortunately, Capture NX is able to remove the CA to the very last trace. For this reason, I strongly recommend all owners of Nikon’s older digital cameras to take their photos in NEF format and process them using the Capture NX program, which is able to quickly, automatically and successfully remove the CA.
Taking the photos with Nikon D3 is naturally a completely different story, but not one without a slight disappointment. The built-in algorithms for CA removal are apparently not as aggressive as the ones used in Capture NX. Namely, even considering that the extent of CA in D3’s JPG images is incomparable to D2x, traces of very weak CA can still be spotted. However, CA is so weak that it will not be noticed on most photographs, so the photos can be taken in JPG format with peace of mind. It seems Nikon D3 succeeds in removing CA originating from the lenses, but not all of the additional CA introduced when our photos are taken under water through a flat port.
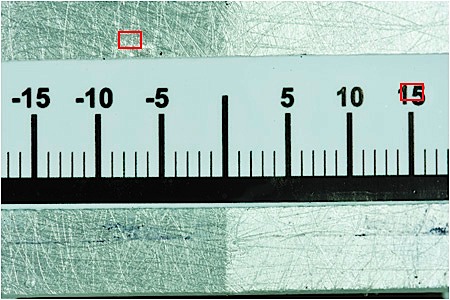
I find a lot more important tests focused on the comparison between the depth of field and the problem of diffraction. In this test, the photos taken with Nikon D2x were made from 1.5x the distance as with Nikon D3, so I was able to obtain the same 36 mm crop. For the diffraction test, I selected a point to which I focused using the selected sensor. The sample 100% crops used to test the depth of field were taken from a point situated 15 mm right of the centre of image (and block), which is exactly 3 mm behind the focusing plane. I have taken the photos using f-stop values from f/5.6 to f/45 in steps of 1. I used autofocus (AF-S – single servo) with a single sensor selected (left to the central sensor). Each image was taken twice and the sharper of the two was selected.
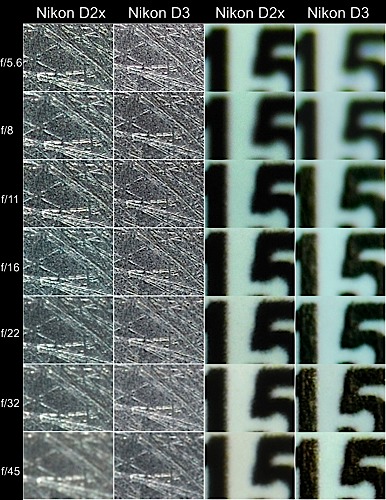
Nikon D2x photos prove the sharpness remains practically unchanged until f/11, starts to deteriorate slightly at f/16 and then decreases linearly to f/45, where the image is completely useless. A similar decrease in sharpness is observed for Nikon D3, but shifted by approximately one f-stop: the images are equally sharp until f/16 and a hardly observable fuzziness occurs at f/22. The fuzziness at f/32 is very similar to the fuzziness observed with Nikon D2x at f/22. It is evident that the diffraction follows the simple formula stated above quite well in real-life circumstances.
The depth of field is somewhat more difficult to evaluate, but I think the real differences are significantly bigger as predicted by our previous theoretical calculations. Nikon D2x has a noticeably greater depth of field, observed especially with smaller f-stop values. Concluding from the test results, I may even ascertain its advantage is almost two f-stops. Naturally, this could also be a consequence of errors in focusing. One thing I have noticed is that the autofocus in Nikon D2x is somewhat less precise due to the size of its AF sensors, which are considerably larger than the sensors in D3. The depth of field increases linearly with aperture stopping down in both cameras, wherein the best sharpness with D2x is obtained at f/22. Stopping down even further, the effect of diffraction becomes so strong that it offsets any positive effect of a greater depth of field. The photo made with f/45 is noticeably fuzzier as the photo made with f/22. The photos taken with the D3 (having a smaller depth of field as well as diffraction) are consistently gaining on sharpness with smaller aperture, the best sharpness obtained right at f/45.
The conclusion of comparative macro tests is that the effects of depth of field and diffraction cancel each other out. The advantage of DX format over the FX format in the depth of field is lost due to diffraction. In order to get the same image sharpness with both cameras, the aperture must be stopped down by one further f-stop for FX format. However, all these statements are accurate only when both sensors have an approximately equal number of pixels! Using a camera with a greater number of pixels (e.g. D3x) puts us at a loss: the FX format means a reduced depth of field, and the smaller pixels amplify the problem of diffraction…
Without a doubt, I can stress once more the significant advantage of DX format over FX format in macro photography is, when the photographer wishes to make as small a crop of nature as possible (“super macro” photography).
Wide-angle photography.
All wide-angle lenses were tested on land and under water in a swimming pool and using a test chart. I have also tested the fisheye lenses in “real-life conditions” in the sea. The test chart was a 120 x 80 cm test image, mounted on a dibond plate. The plate was attached to an aluminum frame. The land and pool photos were taken with the camera housings attached to a stable tripod. I used two flash units for lighting (the land photos were taken using underwater Seacam flash units, too), using all f-stop values and 1/250s shutter speed to eliminate the influence of ambient light and any fuzziness due to the shaking of the camera. The Seacam flash units provide a very wide range of flash intensities, so I was able to achieve optimal illuminations at all f-stops.
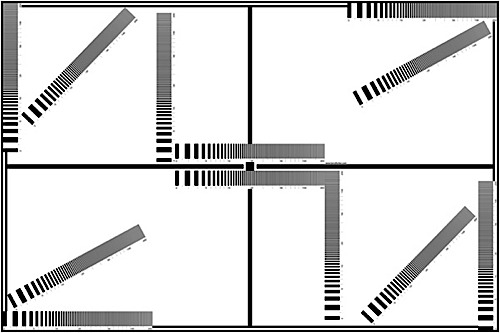
There is no quantitative meaning to the numbers on the test chart and they only serve for the relative comparison of sharpness – the same number means the same sharpness. In rare cases, the lines on the test chart have blended to greyness through the color moiré effect. This means that the lens sharpness has exceeded the resolution of the image sensor, which consequentially misinterpreted the lens image. But in most cases the lines have blended well to a uniform greyness, meaning the image sensor resolution has exceeded the resolution of the optical system.
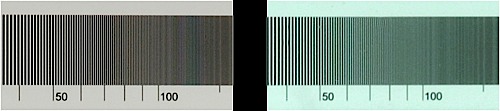
My test is completely unscientific and is based on the subjective assessment of sharpness. Closely observing the images on a large 24” monitor (1920 x 1200 resolution) under 100% magnification, I tried to determine the value where the lines blended to a whole. Although my evaluation was subjective, I believe the deviations of my assessments never exceeded +/- 10%. When I entered the results into an Excel spreadsheet and created the charts, I was pleasantly surprised to see the curves were very nice and clearly trending according to the theory and pure logic. In other words: if I determined the system A to be sharper than system B under certain conditions, the difference can be a bit smaller or a bit bigger, but in each case I am convinced that A is better than B.
Dome port theory.
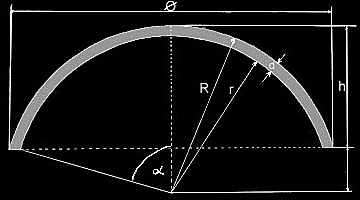
Dome ports are the most common correction system used in underwater wide-angle photography. The dome port is defined by two spherical surfaces (outer and inner) having an identical centre of curvature (centre of sphere) and therefore forming a concentric dome. The difference of curvature radiuses of both surfaces equals the dome port thickness, which must be completely uniform.
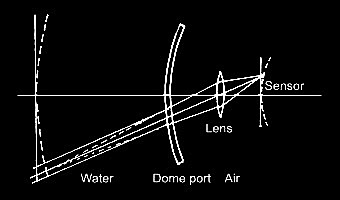
The basic operating principle of a dome port is bringing the light rays into the lens in such a way that there is no refraction on the water-glass-air boundaries. This removes all CA, distortions and magnifications as the main optic problems occurring when the photos are taken from behind a flat port. This is only possible if the rays are entering the glass (almost) perpendicularly. Since all lines going through the centre of a sphere intersect the spherical surface at the right angle, the basic conditions for the successful correction with a dome port are placing the lens exactly in the centre of the sphere and perfectly aligning the lens’ optical axis with the dome’s optical axis. The light rays enter the glass approximately perpendicularly and therefore do not refract, retaining the lens angle of view.
Consequentially, only zoom lenses that don’t change its physical size significantly while zooming are suitable for photography with a dome port. Among the Nikon FX lenses, the 16-35mm f/4 is much more suitable than the “legendary” 14-24mm f/2.8, the latter changing the position of its front optical element strongly while zooming.
All that being said, it is clear that one single dome port cannot be used with several different lenses. Each lens requires very accurate positioning that depends mainly on its physical length. In practice, one dome port and several extension rings can be used to adapt the distance between the dome port and the lens.
Although it succeeds well in removing the aberrations of a flat port, mainly the chromatic aberration, angle of view and distortions, a dome port introduces its own aberrations. A dome port is namely not an a focal system and this leads to two new fundamental dome port aberrations: changed field of focus and curvature of the field.
Changed field of focus.
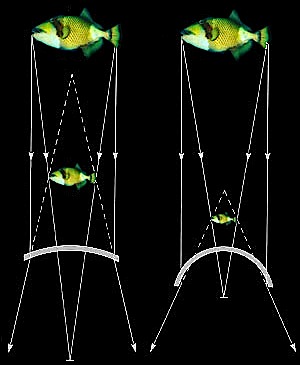
The lens field of focus changes due to the focal properties of the dome port. The dome port and water form together a highly negative lens and the smaller the curvature radius of the dome port, the stronger the diopter of the lens. Objects observed through a dome port appear much closer than they really are. A subject at infinity appears to lie in the far focal point of the dome port. The smaller the curvature radius of the dome port, the closer its far focal point and the closer the image of an object at infinity.
The virtual image of an object closer than infinity lies between the far focal point of the dome port and the dome port itself. The image of the object therefore does not lie in its focal plane, as when photographed in the air, instead it lies behind this plane - leading to a changed field of focus. The difference between both focuses is given very approximately by the following formula:
Where: D is the difference between both focuses F is the focal length of the lens R is the radius of the outer surface of the dome port n is the index of refraction of water (approximately 1.33)
The results for the difference in focuses for both tested fisheye lenses and both fisheye dome ports (all values in millimeters) are provided in the table:
| Equipment | F | R | D |
|---|---|---|---|
| 10.5+Big | 10.5 | 80 | 0.45 |
| 10.5+Small | 10.5 | 50 | 0.73 |
| 16mm+Big | 16 | 80 | 1.06 |
| 16mm+Small | 16 | 50 | 1.69 |
It is evident from the table that the smaller dome port produces a larger change of focus. Furthermore, the lenses with longer focal lengths are more sensitive to the change of focus. The bigger the ratio between the radius of the dome port and the focal length of the lens, the better the optical quality of the image. According to the theory, the large dome port therefore has an advantage over the small dome and the AF Nikkor 10.5mm f/2.8DX lens has an advantage over AF Nikkor 16mm f/2.8. In the extreme case (16mm lens and small dome port), the change of focus is so big that the lens no longer compensates and the system is no longer able to focus! The 1.69 mm change of focus could only be compensated by a 16mm lens focusing to approximately 16 cm, but the smallest focusing distance of AF Nikkor 16mm f/2.8 is 25 cm.
Curvature of the field.
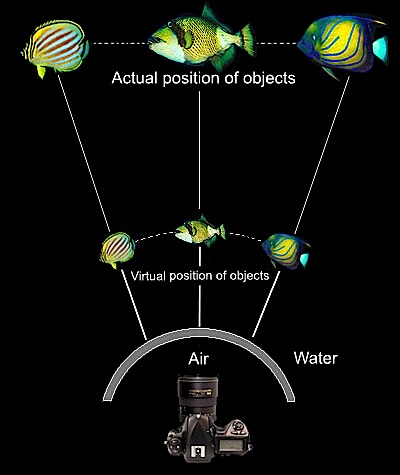
In conventional land photography, the lens “sees” remote objects as if they were lying on a plane at “infinity.” Taking photos of remote objects under water through a dome port, the lens “sees” them as if they were lying on the surface of a sphere, concentric with the curvature centre of the dome port, and not on a plane.
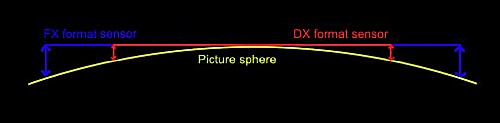
As we are therefore actually taking photos of virtual objects lying on a spherical surface, the image created by the lens will not be lying on a plane either. The image lies on a spherical surface, touching the focus plane of the lens in its vertex. The centre of image’s spherical surface is positioned behind the image sensor, so in corners the effect of field curvature is added to the change of focus to additionally impair the results.
The field curvature phenomenon increases progressively (not linearly!) from the centre to the corners of the image, meaning the sensor size has a very important role. Herein lies the advantage of the smaller (DX) image sensor over “full-frame” (FX) sensors. Both errors can be alleviated to some extent by stopping the aperture down and thereby increasing the depth of field.
The field curvature is less serious when the curvature radius of dome port is large. As a rule of thumb, both errors can be kept within the allowable limits if the dome port’s curvature radius is 10 times larger than the focal length of the basic lens and if the dome port walls are thin.
Unfortunately, this requirement is technically infeasible because such dome ports would be too big, clumsy to use and expensive to manufacture. A dome port with a curvature radius 5 times larger than the focal length of the basic lens can be considered pretty good (and large). In real-life photography, better results are obtained using lenses with short focal lengths that come closer to fulfilling these requirements - mainly the fisheye lenses.